
Charts
Custom charts and dashboards
Build custom charts and dashboards for data visualization. See your data in real time and turn complex information into easy-to-read visuals.
A dashboard built from 10 projects: 10 projects, 4 clients and $125,970 of Budget in total. Budget by due date, week by week: Nov 2, $16,855; Nov 9, $24,690; Nov 16, $48,250; Nov 23, $17,435; Nov 30, $18,740. Projects by status: 3 Planning, 3 In progress, 2 Review, 2 Done.
Make your data easier on the eyes
Chart selection
Choose from a wide range of charts
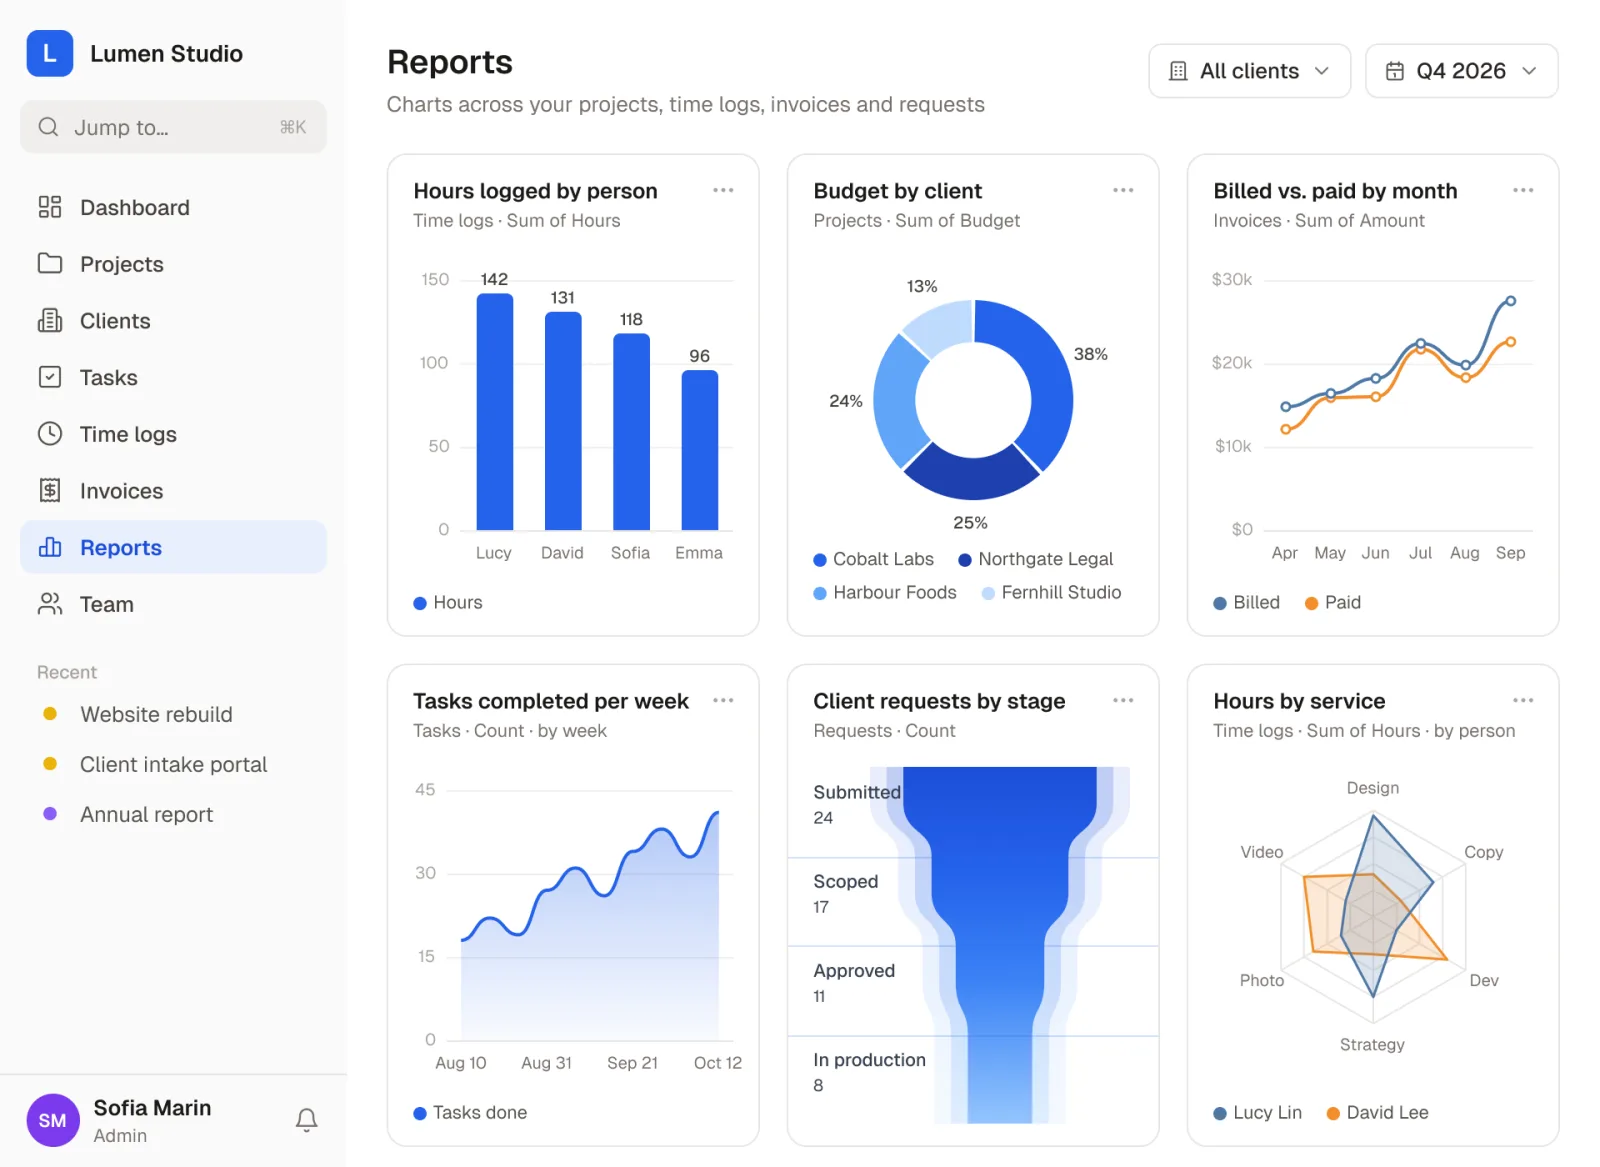
Pick from a variety of chart options, including bar, area, line, funnel, radar and donut charts. It’s completely up to you!
Dashboard creation
Create dashboards with multiple charts
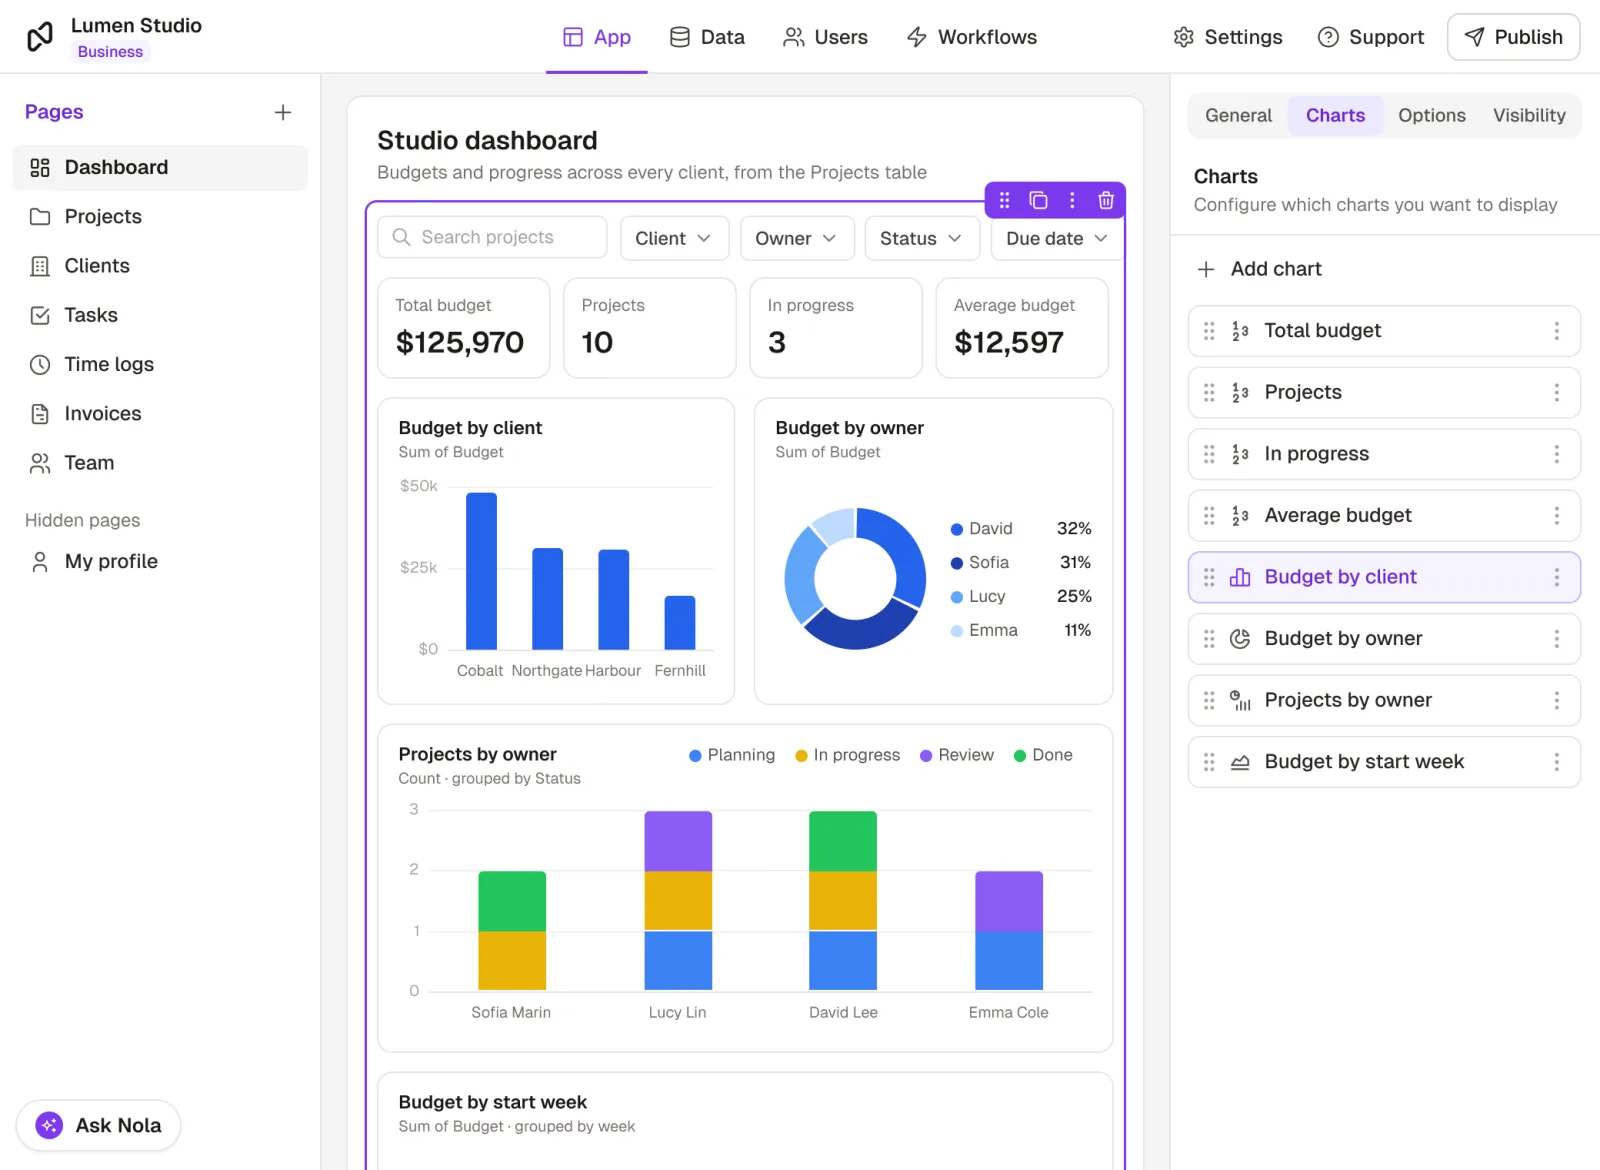
Combine multiple charts on a single page, apply dynamic filters across your entire dashboard, and give users the power to explore data their way. Customize chart layouts to match your design vision.
Data display
Display only the data you choose
Easily pick which data from your collection to show on the X and Y axis. You can also create data visibility rules for which charts each user should be able to see.
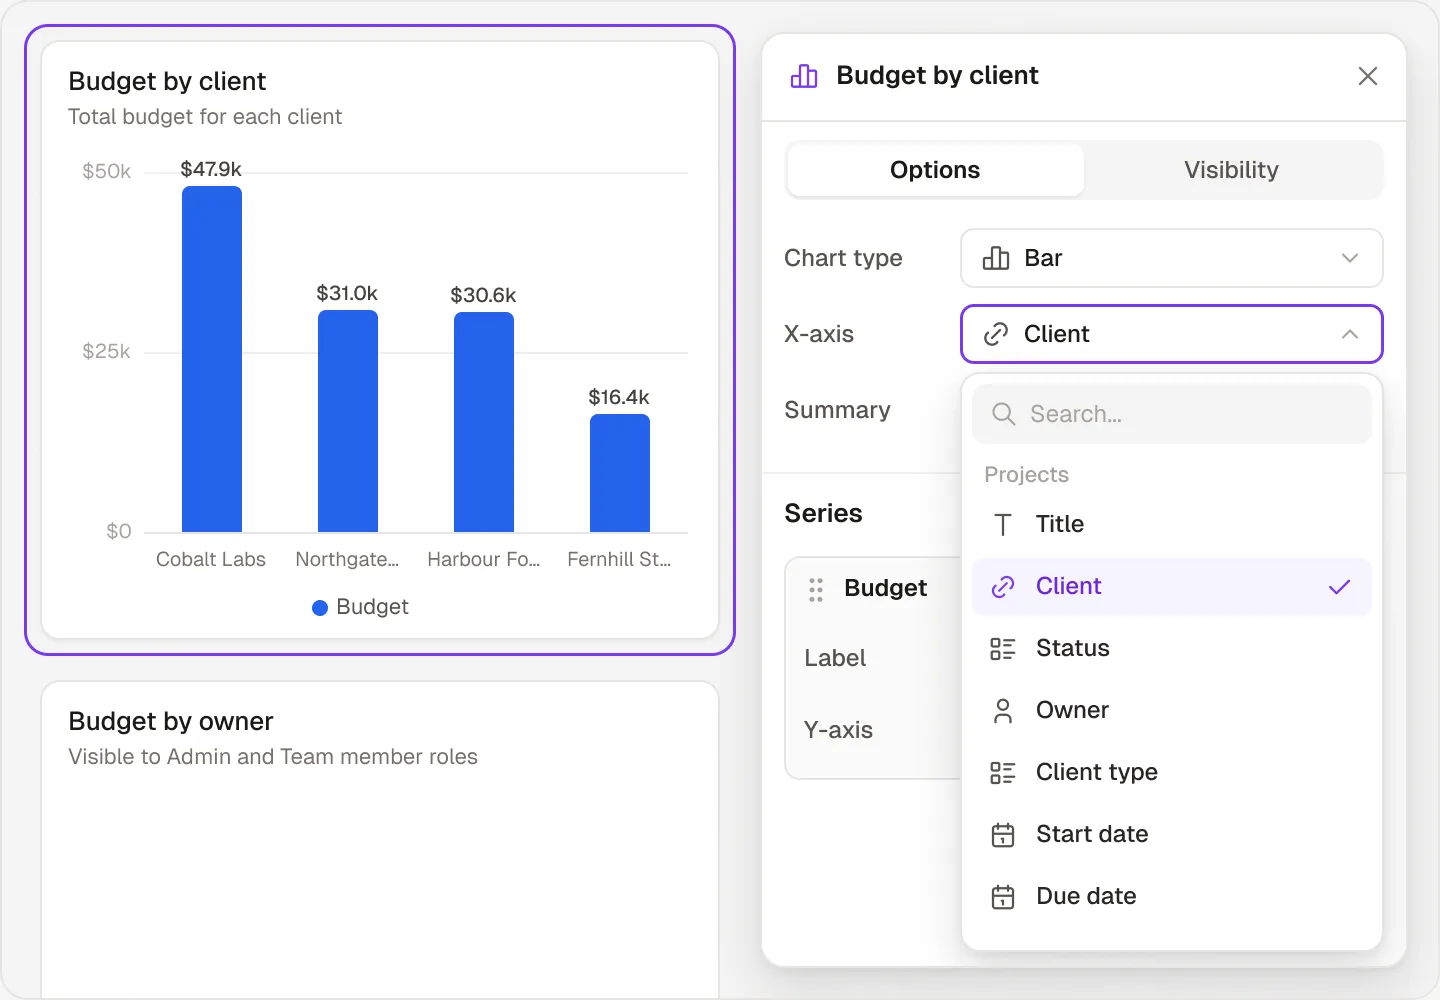
Chart configuration
Customize your charts
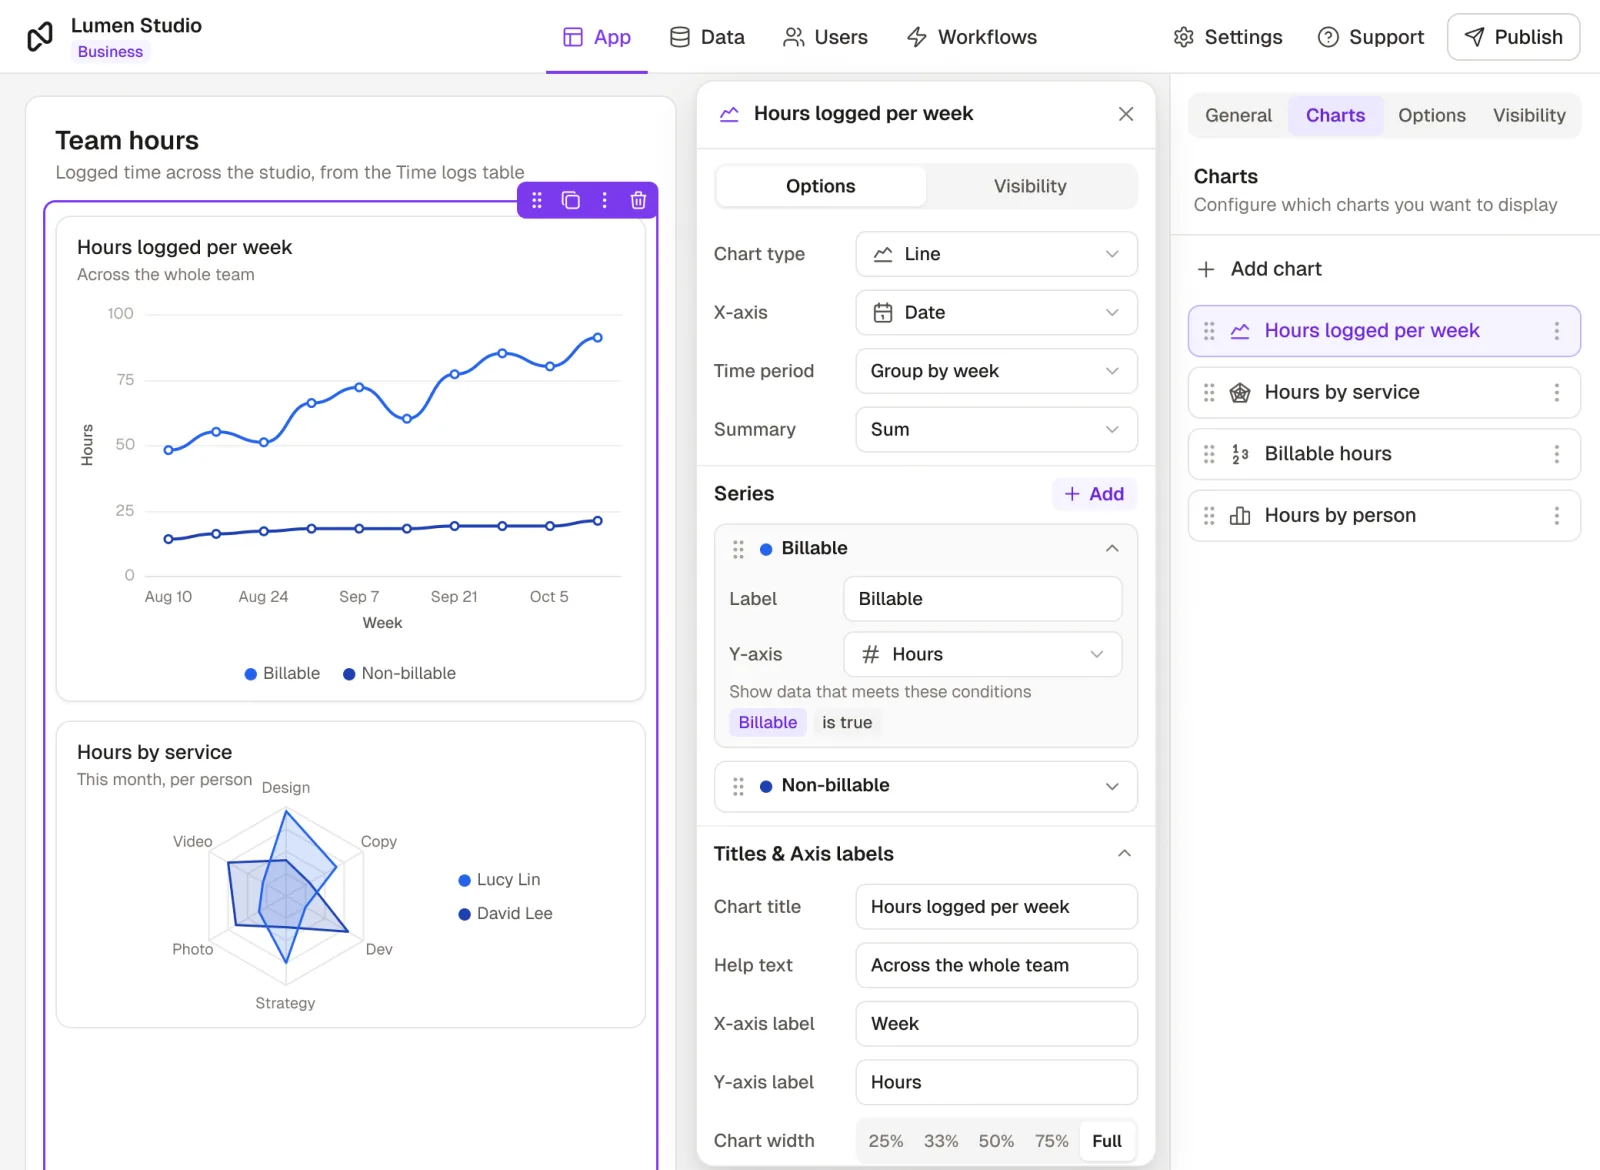
Add multiple data series, group records by time periods, and define precise chart and axis titles, all through a simple, user-friendly interface.
Customer stories
Teams building with it



Create your first chart and let the results speak for themselves
Gain instant insights and make data-driven decisions, with confidence!
No credit card required